Since Plasma 5.18, nearly five years ago, Plasma has shipped with a "telemetry" system. It’s opt-in, allowing users to send a small amount of data back to us.
Was it useful or worth it? It's a question that comes up occasionally, and the answer is mixed. I believe it showed real potential, though the reality of our implementation was somewhat underwhelming and didn't really deliver. There are many lessons learned that are worth sharing with other projects that might face similar endeavours.
The good bits
Where we had data available for topics being discussed it worked. To give two concrete examples from memory:
-
A developer claimed, "No one is using a screen smaller than 1024x768," while bumping the minimum size of a window. This was proved wrong; the number of users at 800x600 or even 640x480 is surprisingly high. Still low as an overall percentage, but higher than you would ever intuitively think. Presumably, it's the default for a lot of virtual machines.
-
Four years ago, a developer claimed, "No one still uses only OpenGL2; we can change the code to do XYZ." A check of our user base showed it would have affected nearly 5% of our users, so the change was abandoned.
Interestingly, this last topic came up again very recently, as it held back colour management improvements, but in a narrower Wayland-only path and with a fallback. After checking metrics again, the usage was below 1%, so we went ahead with that merge request.
So, are metrics worth it just to stop developers and designers from making nonsense claims out of thin air? Absolutely! 90% of stats are just made up on the spot. Metrics are just as much about preventing changes as it is about sparking changes.
Indirect impact
The other important part is having a more general sense of the landscape. Currently, we have a lot of hard conversations about how quickly we push the move to Wayland. We have voices wanting to maintain support, and we have voices wanting to push quicker. These decisions shouldn't be made just by who can be the loudest. For every individual topic that came up in those discussions, I would always have in mind our current adoption value at the time.
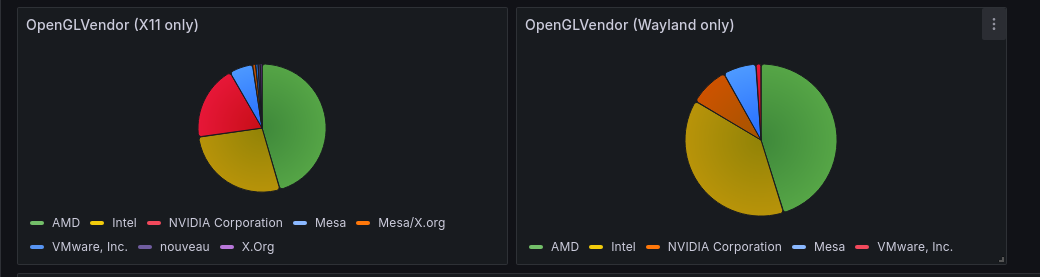
Should we care about Nvidia? Knowing they make up about 25% of our user base makes the decision for us. I ran with an Nvidia card in one machine because of this, implementing Nvidia context loss handling and doing what we could during the Wayland transition
We don't test BSD while developing Plasma, but we also let it hold us back. Should we care about it more or less? My opinion matches exactly what the metrics say.
Some stats and graphs:
Another role of metrics is being a conversation starter—people will fawn over a graph. More topics on Reddit will be about our Wayland usage rather than the topic I'm trying to discuss. I'll focus on Wayland examples beacuse that's a topic close to me.
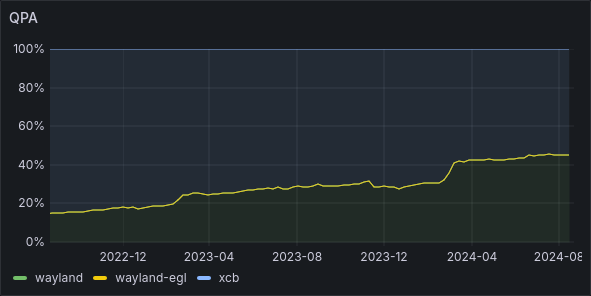
Wayland adoption over time
I keep tabs on what our metrics show here. We can see the slow increase from under 20% to around 45% over time, showing the progress as both we and the Wayland ecosystem evolved. At Plasma 6, we switched the defaults a small bump in the graph can be seen. but 45% still seemed rather disappointing.
Filtering on just Plasma 6 reveals the true story:
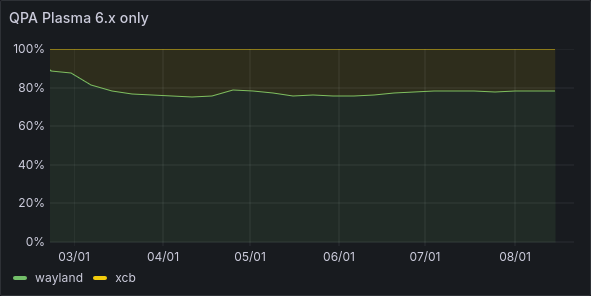
There's still 20% of users switching away, or using a distro with a different default, or having carried over presets, but it's more promising. Interestingly, we can see that the GPU vendor distribution differs between X11 and Wayland.
Problems and lessons learned
Ultimately, despite the positive parts it would be hard to call our telemetry a staggering success. For the handful of examples above, there are a hundreds of cases where we had no data to back anything up. The range of data points was pitiful and it wasn't often used
The viewing tool is really, really important!
Data collection without viewing it is meaningless. As shown above, we often need to drill down and cross-reference filters to extract conclusions.
The original plan was to use the existing UI provided by kuserfeedback, which did not scale at all and quickly fell over. It was designed for high-fidelity data for a small number of users, not what we had.
In a rush, we pivoted to using Grafana because there was already a setup hosted.
It worked—ish, but it’s not designed for this, especially combined with our data structure, which was a manual NoSQL in normal SQL. Every graph needed to be written by hand, and it felt very much like fighting the system rather than working with it. Combined with the limited access permissions granted, it wasn't used by many people.
It being used is the number one indicator of its usefulness!
We need to find a tool specifically designed for visualization and querying datasets (maybe Apache Superset?).
Time-based data just makes noise
Our system sent updates every N days with basically the same data every time. This made writing queries way messier than it should have been. It never added any value; I would always be interested in what the current stats are. As described in the Wayland usage graphs above, if I'm making a Wayland decision, it doesn't matter what most people are using; it matters what people on the latest release are using. We always ended up having to add filters to focus on just the latest version.
The upgrade story needs planning in advance
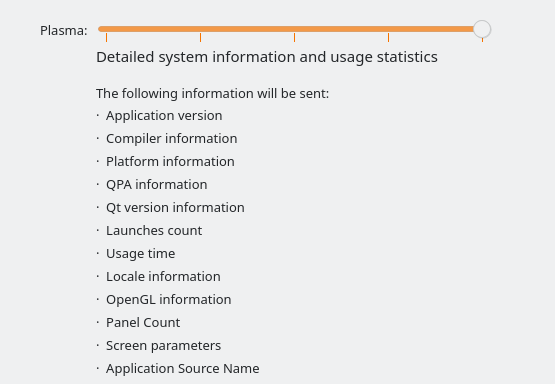
The amount of data we collected was tiny—some GPU information, screen information, language, and a few other fragments. The plan was to slowly add more and more stats over time, but we hit a wall. Our UX involved the user selecting to enable metrics and it being a fire-and-forget operation.
What do we do when we want to add more data? For example, whether you use an analog or digital clock. We would need to prompt the user and reset their settings in the meantime, which is at odds with it being a setting. The whole thing became such an ordeal that made it not worthwhile.
Wrap up
The project didn't fail, when we had data and it was used it worked, but overall our implementation falls short. I would like to open a discussion at Akademy on how we move forward with our current system potentially starting from scratch treating it more like a survey that we prompt to auto populate and submit each year.